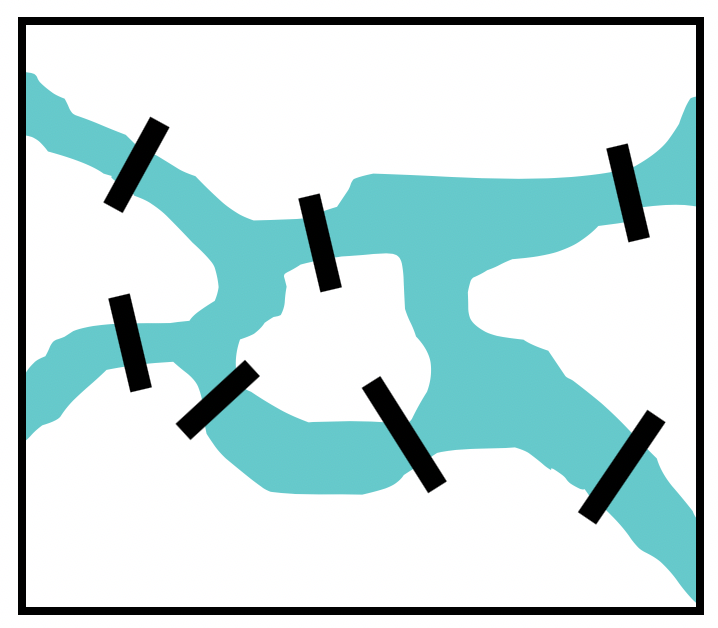
In the time of Euler, in the town of Königsberg in Prussia, there was a river containing two islands. The islands were connected to the banks of the river by seven bridges (as seen below). The bridges were very beautiful, and on their days off, townspeople would spend time walking over the bridges. As time passed, a question arose: was it possible to plan a walk so that you cross each bridge once and only once? Euler was able to answer this question. Are you?
The problem above, known as the Seven Bridges of Königsberg, is the problem that originally inspired graph theory. Consider a “different” problem: Below is a drawing of four dots connected by some lines. Is it possible to trace over each line once and only once (without lifting up your pencil, starting and ending on a dot)?
There is a connection between these two problems. Any path in the dot and line drawing corresponds exactly to a path over the bridges of Königsberg. That is, every line represents one of the bridges. Let's consider another example.
Example4.1.1
Figure4.1.2 Video solution by David Lippman
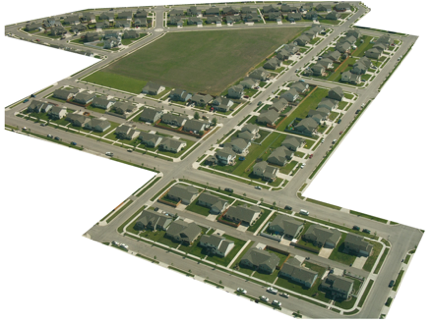
Here is a portion of a housing development from Missoula, Montana. As part of her job, the development’s lawn inspector has to walk down every street in the development making sure homeowners’ landscaping conforms to the community requirements.
Naturally, she wants to minimize the amount of walking she has to do. Is it possible for her to walk down every street in this development without having to do any backtracking? While you might be able to answer that question just by looking at the picture for a while, it would be ideal to be able to answer the question for any picture regardless of its complexity.
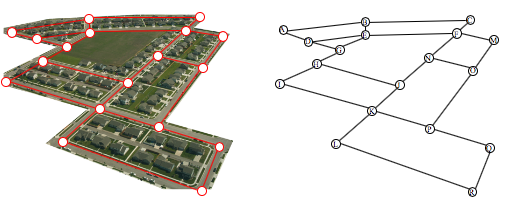
To do that, we first need to simplify the picture into a form that is easier to work with. We can do that by drawing a simple line for each street. Where streets intersect, we will place a dot.
Now we can think about answering the question without being distracted by extraneous information (like the houses and trees).
Pictures like the dot and line drawing are called graphs. Graphs are made up of a collection of dots called vertices and lines connecting those dots called edges. When two vertices are connected by an edge, we say they are adjacent. The nice thing about looking at graphs instead of pictures of rivers, islands, bridges, and houses is that we now have a mathematical object to study. We have distilled the “important” parts of the bridge picture for the purposes of the problem. It does not matter how big the islands are, what the bridges are made out of, if the river contains alligators, etc. All that matters is which land masses are connected to which other land masses, and how many times. This was the great insight that Euler had.
We will return to the question of finding paths through graphs later. But first, here are a few other situations you can represent with graphs:
Example4.1.3
Al, Bob, Cam, Dan, and Euclid are all members of the social networking website Facebook. The site allows members to be “friends” with each other. It turns out that Al and Cam are friends, as are Bob and Dan. Euclid is friends with everyone. Represent this situation with a graph.
Each person will be represented by a vertex and each friendship will be represented by an edge. That is, two vertices will be adjacent (there will be an edge between them) if and only if the people represented by those vertices are friends. We get the following graph:
Example4.1.4
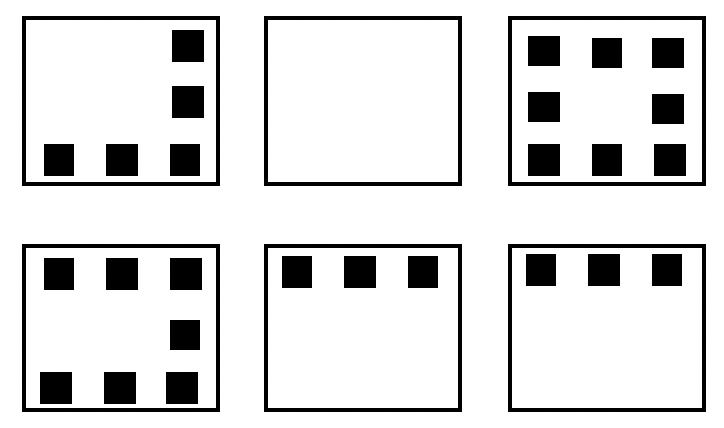
Each of three houses must be connected to each of three utilities. Is it possible to do this without any of the utility lines crossing?
We will answer this question later. For now, notice how we would ask this question in the context of graph theory. We are really asking whether it is possible to redraw the graph below without any edges crossing (except at vertices). Think of the top row as the houses, bottom row as the utilities.
Sometimes it will be convenient to assign a direction to edges in our graphs. Such a graph is called a directed graph or digraph.
Example4.1.5
On the social network Twitter you may "follow" someone whether or not they follow you. Model the situation where Alice follows Barb and Carl; Barb follows Alice and Denise; Carl follows Alice, Barb, and Denise; and Denise follows only Carl.
To deliver mail in a particular neighborhood, the postal carrier needs to walk along each of the streets with houses (the dots). Create a graph with edges showing where the carrier must walk to deliver the mail.
2
Suppose that a town has 7 bridges as pictured below. Create a graph that could be used to determine if there is a path that crosses all bridges once.
3
Describe a graph model that represents a subway system in a large city. Should edges be directed or undirected? Should multiple edges be allowed? Should loops be allowed?
4
Describe a graph model that represents a network of relationships on a social network. Should edges be directed or undirected? Should multiple edges be allowed? Should loops be allowed?